
Disclaimer: This site is not affiliated with the National Hurricane Center, Hurricane Hunters, Storm Prediction Center, or National Weather Service. ALL forecasts herein are the result of my analysis, and I am solely responsible for the content.
(T. F. “Storm” Walsh III)
For those who have donated to my site, your help has been greatly appreciated. For those not aware, donations to my site help me offset my out of pocket expenses…such as some of the model maps you view on here, which are only available due to my subscription to the corresponding sites. The F5 Data maps I post as well, is another out of pocket expense (monthly subscription). Updates to software (weather related), and costs for my domain name are also out of pocket to me. To donate, please click the DONATE button to the right. Any help you provide is immensely appreciated!
Good day everyone!
This is quite long, but well worth the read…trust me!
As we draw close to that time of year…the 2017 Atlantic Hurricane Season, I wanted to take the time to issue my update, pre-season forecast. There are various factors which may be in play that argue for a slightly below average season. First, the factor everyone has been talking about…El Nino.
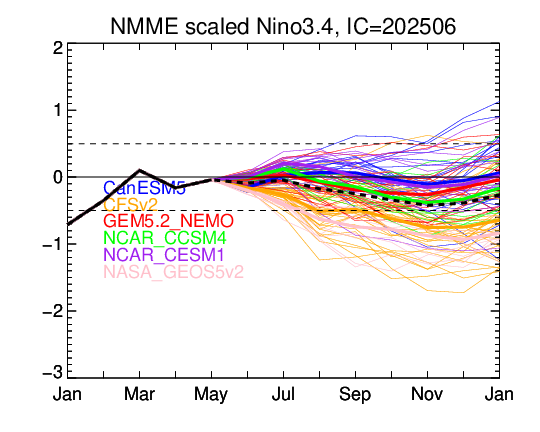
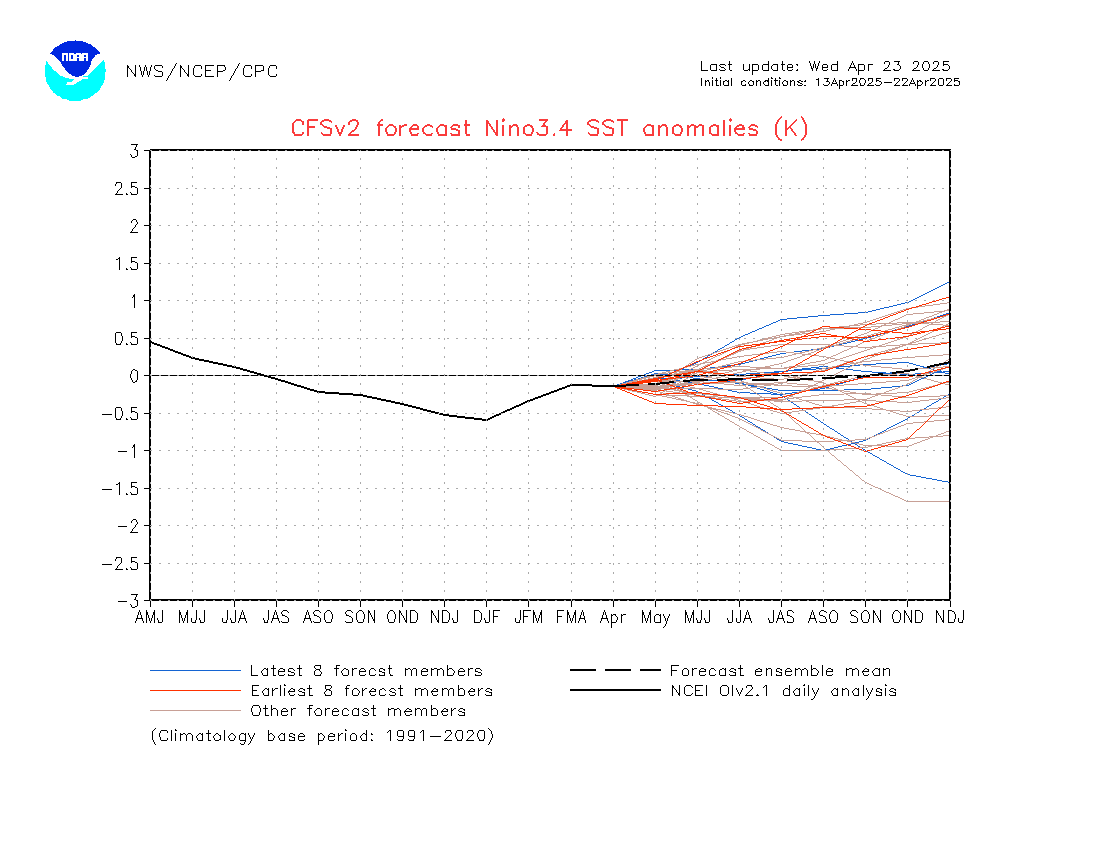
There is a very good probability we may see the onset of another El Nino this season. However, given forecasts from climate models near and at the end of 2016, and data from earlier in this year, the question remains as to how strong, and how quick El Nino may take shape. In my analysis of some of the climate model data, based on last and most recent updates of NINO plumes, the EUROSIP model has not updated as of the MAR. 01 2017 forecast. Data from the Australian BOM (Bureau Of Meteorology) indicate a fluctuation between 2/26/17, 3/12/17, and 3/26/17 with a downward trend noted in the 3/26/17 graph update. The CFSv2 climate model, and the NMME modeling have also shown a downward trend in the Nino 3.4 region. In this forecast, I will be utilizing the current information, and the forecast may need to be adjusted, once the EUROSIP model updates. Previous forecast indicated Nino 3.4 region values to attain around 1.6 – 1.7 C above average. The current “mean” or average now shown by 8 climate models sampled by BOM, has fallen to just slightly below 1.2C. This would almost indicate a “neutral, warm biased” Nino. It is noted, the SOI (Southern Oscillation Index) has been hanging in the positive value area on the 30 day running mean graph. As long as the SOI remains in a “positive phase”, warming in the Equatorial Pacific will slow, or cease temporarily. When the SOI is in the positive, it indicates MSLP over Darwin Australia is lower, and MSLP over Tahiti is higher. This allows the Equatorial Trade Winds to blow from east to west…this is known as the PGF (Pressure Gradient Force…wind flows from high to low pressure). This brings the Humboldt Current toward the west, which is colder water. When the SOI is in the negative, the opposite occurs, allowing for warmer sub-surface water to be pushed from Australia, eastward toward south America, where it strikes the coast underwater, and upwells to the surface, and back toward the west, creating the “warm tongue” we are familiar with.
The following are recent model data updates regarding Nino plumes, climate model forecasts, and SOI 30 day running mean:
SOI 30 DAY RUNNING MEAN

BOM EL NINO FORECAST CHART MAR. 26, 2017

BOM EL NINO FORECAST APR. 09, 2017

NMME NINO PLUME FORECAST (ALL MEMBERS)
CFSv2 NINO PLUMES
ENSO UPDATE:
http://www.bom.gov.au/climate/enso/#tabs=Overview
The next items I wish to touch on are SST (Sea Surface Temperature) anomalies and TCHP (Tropical Cyclone Heat Potential), also referred to as OHC (Ocean Heat Content).
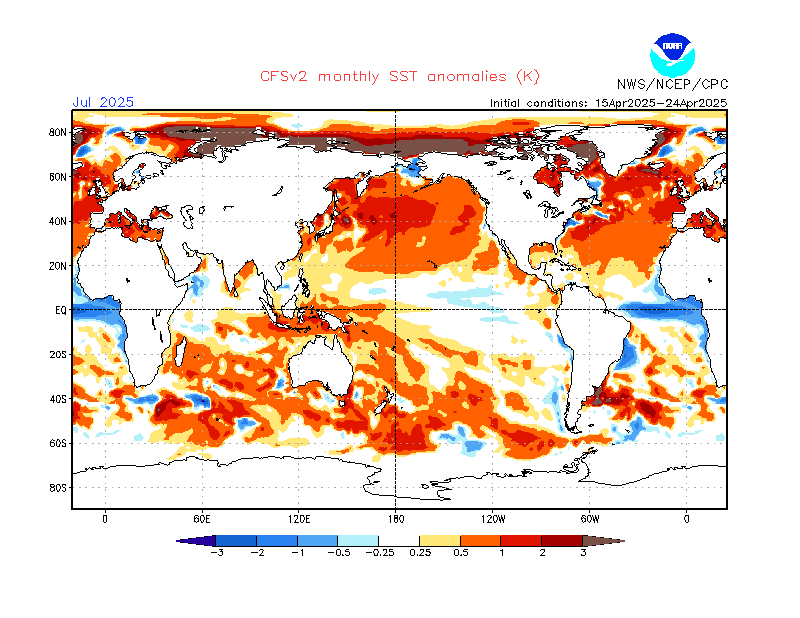
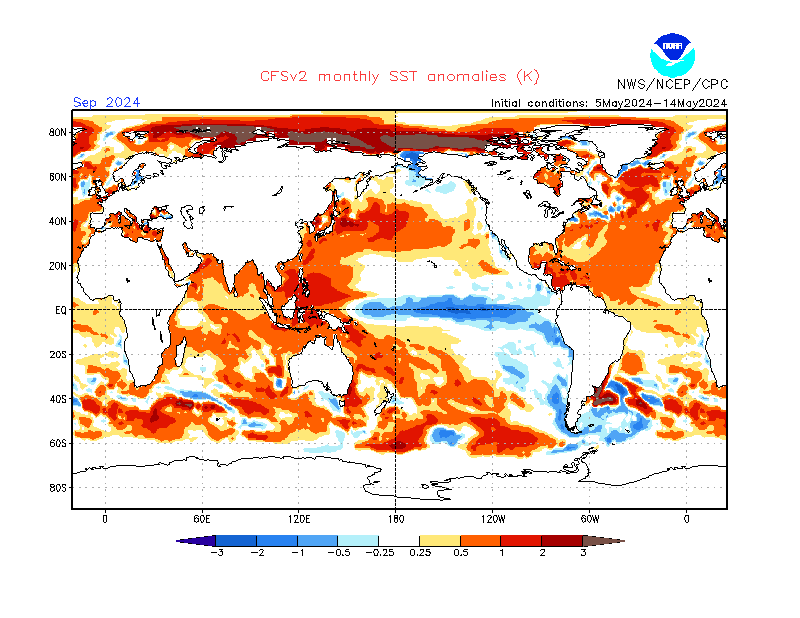
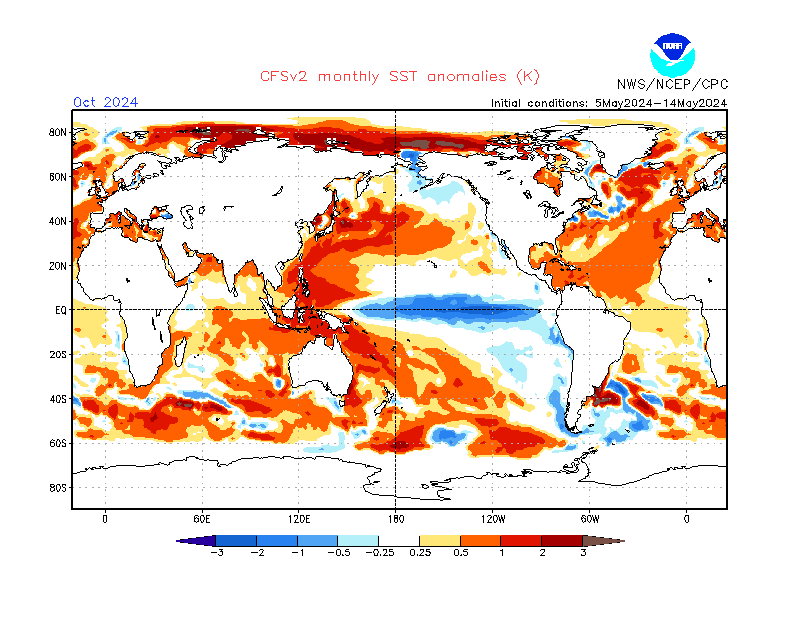
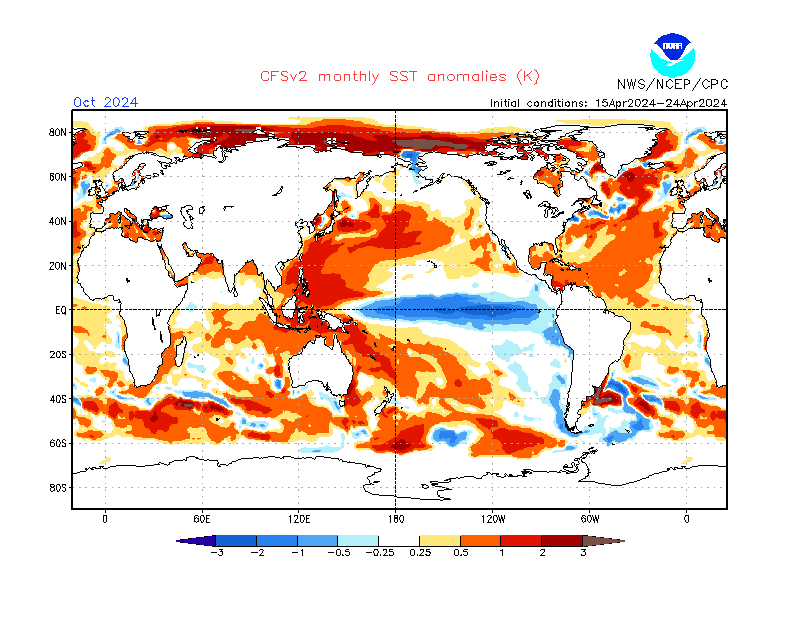
Current SST anomalies indicate the NINO 3 and NINO 3.4 regions have warmed, with the Atlantic basin showing average to below average anomalies. Based on the latest CFSv2 update, Atlantic SST anomalies should remain average to below average over the MDR this season, with continued warming in the Pacific. Warmer SST anomalies are forecast to be mainly over the western and central GOMEX, and very close to portions of the U.S. coast. IF the forecast and conditions do not change, once again, I would not look for any type of Cape Verde season to speak of, or anything worthwhile and long tracked out of the Atlantic. Albeit this points to average to below normal storm activity, the concern is more close in development and “home brew” as we call it. Storms of this nature, given what I’ve read about the forecast pressure patterns, could allow for anything that develops close, to ramp up quickly. If conditions are favorable, one cannot rule out the possibility of a “major” with this setup. I am borrowing a map from a “colleague”, Meteorologist Joe Bastardi from Weatherbell Analytics (whom I learned a great bit of my forecast skills from). The map matches up well with the current SST anomalies…this will allow you to see what we are speaking of, and why Joe’s map looks as such.
NINO REGIONS MAP

CURRENT OPERATIONAL SST ANOMALIES FROM NOAA
SST ANOMALIES FROM WEATHERBELL

WEATHERBELL HURRICANE FORECAST MAP
CFSv2 SST ANOMALY FORECAST JUN-SEP
Speaking of Africa, Not sure how the dust situation may play out. Generally, we see a lot of African dust (SAL…Saharan Air Layer) during June, July, and even sometimes into Aug., with the worst outbreaks occurring in the month of July. It is unknown right now if we may see an increase in SAL and outbreaks, as the African continent is very dry, especially over the Sahel region. The following map represents the total percentage of rainfall received over the most recent 90 day period, as compared to “normal”
90 DAY AFRICAN RAINFALL
The Atlantic is also currently below in TCHP as compared to last year. TCHP has to do with the depth of the 26.0C isotherm, and how far down it extends. As a general rule for hurricane development, the isotherm has to extend down through the sub-surface approximately 50 meters, or about 150 feet. In the Tropical Atlantic, SST’s need to be at least 80F to get things going. The current TCHP and SST’s would support development in the Caribbean. The higher the TCHP, the more energy available for a hurricane. Values of 60 j/cm2 or greater, will not only support a hurricane, but if all other conditions are favorable, will allow for a hurricane to undergo R.I. (Rapid Intensification). The following 2 maps are for comparison.
NOAA / AMOL TCHP APR. 10, 2016

NOAA / AMOL TCHP APR. 10, 2017

The next and final item I’d like to touch on is wind shear. Wind shear, by definition, is the changing of wind direction and/or wind speed over a short distance as you go up through the atmosphere. During hurricane season, we look for values of vertical wind shear in analysis to determine whether or not development of a disturbance, or strengthening of a storm may occur. As a rule of thumb, vertical shear must be less than 20 knots for development to occur. With the onset of an El Nino, wind shear increases over the Atlantic MDR. The effect of wind shear does the following to a storm:
It blows the thunderstorm tops away from the center of the storm, thus convection cannot build.
It also “tilts” the storm (generally from west to east). Think of a child’s spinning top…when it tilts, what does it begin to do?
Shear also disperses the heat from a tropical storm or hurricane over a larger area. For a storm to develop, or for a hurricane to intensify, the “heat” must remain in a fairly straight “column”
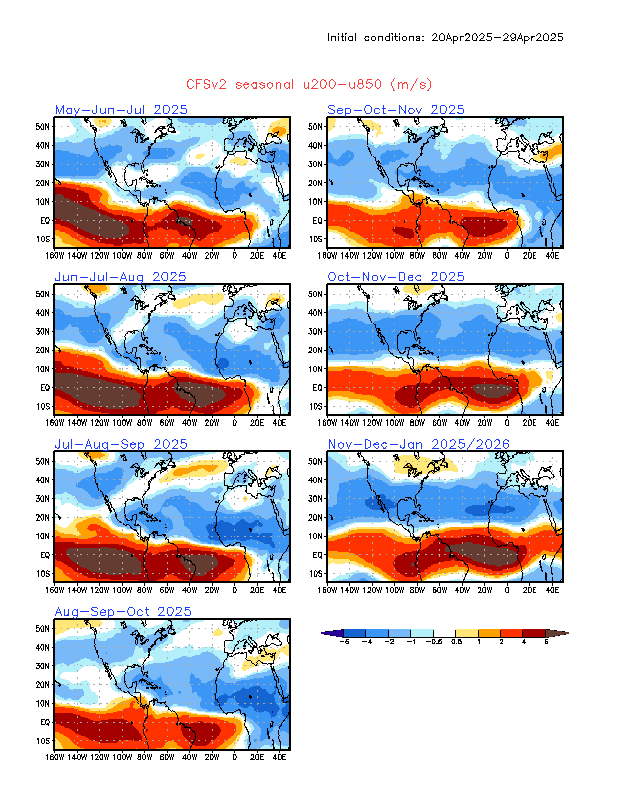
The last 2 updates from the CFSV2 climate model indicate vertical wind shear was going to be above average over the MDR for this season. However, based on the recent 200 – 850 mb winds forecast, shear may only become slightly above average to average over the MDR, and below average over the GOMEX and north of the MDR. MDR by the way, stands for Main Development Region.
MDR GRAPHIC

CFSV2 200 – 850 MB WINDS FORECAST
 You may have also noted last season, at various times, surface winds across the Atlantic Basin and into the Caribbean Sea were fairy brisk. Strong surface winds will also hinder storm development, pretty much in the same way vertical wind shear affects them. For development, SST’s should be a minimal 80F. This “magic number” adds to the evaporation rate of the ocean, and adds nergy into the lower atmosphere, as long as surface winds are not too strong. When surface winds are too strong, they increase evaporation, however, the heat energy gets spread out over a larger area, and doesn’t allow air to rise in a column, and doesn’t allow for condensation and the release of latent heat of condensation into the atmosphere.
Of course, as the season begins, other factors will come into play, such as the phenomenon of the MJO (Madden Julian Oscillation). The following links are articles on the MJO and the effect it has on tropical storm formation.
MJO EXPLAINED
http://www-das.uwyo.edu/~geerts/cwx/notes/chap12/mjo.html
https://en.wikipedia.org/wiki/Madden%E2%80%93Julian_oscillation
One of the items I (we, as forecasters) look to in determining a higher probability of storm formation, mainly during June, July, October and November is what is referred to as the MJO Phase Diagram Index. This graph is divided into 8 sections, or “phases” and are labeled with the areas each “octant” represents. For our basins (mainly the GOMEX, Caribbean), the octants favored for development during the months mentioned, are octants 8 and 1. The further away from the center that the forecast line is, the stronger the MJO pulse. This is basically and indication of where upward vertical motion, and enhanced thunderstorm activity will be by the forecast date shown. You’ll note I mentioned only 4 months for the MJO phase. This is because during August ans September, we look toward the central and eastern Atlantic basin for development, which usually is brought on by Tropical Waves. Now, the MJO can help during those 2 months, however it is not necessity.
EXAMPLE OF THE MJO INDEX

Based on my analysis of the current climate model information as far as trend and values, and analysis of the ONI (Oceanic Nino Index) chart, the closest analog years appear to be 1957, 1963, 1991, and 2002. The average number of total named storms worked out to be 9.25. Three of the years had 8, 9, and 8 respectively. 2002 came in with a total of 12.
So, based on the current trend and values of the posted El Nino plumes, and the possibility that wind shear may be somewhat less than previously forecast, my 2017 Seasonal Hurricane Outlook is as follows:
Named Storms: 10 – 12
Hurricanes: 4 – 5
Major Hurricanes: 2
To reiterate, should the current trend of the El Nino forecast become even lower, as well as forecast wind shear, I will be revising the forecast, and would not rule out the possibility of an ‘average” season, should the trends occur.
The following information is for your use. Please become familiar with the preparedness brochures.
STORM NAMES FOR THE 2017 HURRICANE SEASON:
Arlene
Bret
Cindy
Don
Emily
Franklin
Gert
Harvey
Irma
Jose
Katia
Lee
Maria
Nate
Ophelia
Philippe
Rina
Sean
Tammy
Vince
Whitney
SAFFIR – SIMPSON HURRICANE WIND SCALE:
| Category | Sustained Winds | Types of Damage Due to Hurricane Winds |
|---|---|---|
| 1 | 74-95 mph 64-82 kt 119-153 km/h |
Very dangerous winds will produce some damage: Well-constructed frame homes could have damage to roof, shingles, vinyl siding and gutters. Large branches of trees will snap and shallowly rooted trees may be toppled. Extensive damage to power lines and poles likely will result in power outages that could last a few to several days. |
| 2 | 96-110 mph 83-95 kt 154-177 km/h |
Extremely dangerous winds will cause extensive damage: Well-constructed frame homes could sustain major roof and siding damage. Many shallowly rooted trees will be snapped or uprooted and block numerous roads. Near-total power loss is expected with outages that could last from several days to weeks. |
| 3 (major) |
111-129 mph 96-112 kt 178-208 km/h |
Devastating damage will occur: Well-built framed homes may incur major damage or removal of roof decking and gable ends. Many trees will be snapped or uprooted, blocking numerous roads. Electricity and water will be unavailable for several days to weeks after the storm passes. |
| 4 (major) |
130-156 mph 113-136 kt 209-251 km/h |
Catastrophic damage will occur: Well-built framed homes can sustain severe damage with loss of most of the roof structure and/or some exterior walls. Most trees will be snapped or uprooted and power poles downed. Fallen trees and power poles will isolate residential areas. Power outages will last weeks to possibly months. Most of the area will be uninhabitable for weeks or months. |
| 5 (major) |
157 mph or higher 137 kt or higher 252 km/h or higher |
Catastrophic damage will occur: A high percentage of framed homes will be destroyed, with total roof failure and wall collapse. Fallen trees and power poles will isolate residential areas. Power outages will last for weeks to possibly months. Most of the area will be uninhabitable for weeks or months. |
HURRICANE WATCH:
An announcement that hurricane conditions (sustained winds of 74 mph or higher) are possible within the specified area in association with a tropical, subtropical, or post-tropical cyclone. Because hurricane preparedness activities become difficult once winds reach tropical storm force, the hurricane watch is issued 48 hours in advance of the anticipated onset of tropical-storm-force winds. During a Watch, prepare your home and review your plan for evacuation in case warnings are issued. Listen closely to instructions from local officials.
TROPICAL STORM WATCH:
An announcement that tropical storm conditions (sustained winds of 39 to 73 mph) are possible within the specified area within 48 hours in association with a tropical, subtropical, or post- tropical cyclone. During a Watch, prepare your home and review your plan for evacuations in case warnings are issued. Listen closely to instructions from local officials.
HURRICANE WARNING:
An announcement that hurricane conditions (sustained winds of 74 mph or higher) are expected somewhere within the specified area in association with a tropical, subtropical, or post-tropical cyclone. Because hurricane preparedness activities become difficult once winds reach tropical storm force, the hurricane warning is issued 36 hours in advance of the anticipated onset of tropical-storm-force winds. The warning can remain in effect when dangerously high water or a combination of dangerously high water and waves continue, even though winds may be less than hurricane force.
TROPICAL STORM WARNING:
An announcement that tropical storm conditions (sustained winds of 39 to 73 mph) are expected somewhere within the specified area within 36 hours in association with a tropical, subtropical, or post-tropical cyclone.
The following information can also be found on the right hand side of this site by scrolling down and finding the LINKS section.
AGAINST THE WIND: Protecting your home from Hurricane Wind Damage
https://www.fema.gov/media-library-data/20130726-1505-20490-3483/agstwnd.pdf
TROPICAL CYCLONES: Hurricane Preparedness Guide
http://www.nws.noaa.gov/os/hurricane/resources/TropicalCyclones11.pdf
HURRICANE PREPARATION FOR BOATERS
http://www.boatus.com/hurricanes/boaterprep.asp
EVACUATION PLANNING: Individuals with Disabilities and Others with Access and Functional Needs
https://www.ready.gov/individuals-access-functional-needs
PET EVACUATION: Pet Evacuation and Pet Friendly Emergency Shelters
http://petfriendlytravel.com/pet_shelters
Have a blessed day!
T. F. “STORM” WALSH III
GMCS, USCG (ret)
METEOROLOGIST / HURRICANE SPECIALIST /SEVERE WEATHER SPECIALIST
MEMBER WEST CENTRAL FLORIDA AMS
CoCoRAHS OBSERVER


Thank you, Storm. I can’t say I like the red gulf area of the Bell Weather map, but appreciate knowing to watch closely this year. I’m putting in an order for next year. I’m going on my first cruise in May or June of 2018 with my husband, sister and brother-in-law for our wedding anniversaries. I’d like to request fair weather and calm seas, please. 🙂 Thank you for all you do, Storm.
You’re welcome
Excellent analysis Storm! Thanks.
Welcome!