
Disclaimer: This site is not affiliated with the National Hurricane Center, Hurricane Hunters, Storm Prediction Center, or National Weather Service. ALL forecasts herein are the result of my analysis, (to which you will see me at times, insert excerpts from various agencies due to the nature of the importance of the information) and I am solely responsible for the content. As ALWAYS, follow the National Hurricane Center, National Weather Service, and your local Emergency Management officials for emergency decisions. In addition, this is strictly a FORECAST OFFICE. I CANNOT make decisions regarding travel plans, etc. My purpose, is to provide you the information, based solely on information I analyze, and the accuracy of the information at hand of the time of analysis, so you may make informed decisions.
(T. F. “Storm” Walsh)
For those who have donated to my site, your help has been greatly appreciated. If you are not aware, donations to my site help pay for subscriptions to sites I use as well as software updates, which provide all the models and information used in my forecasts. To donate, please click the DONATE button to the right side of the page, or on the graphic of the dog. Any help you provide is immensely appreciated!
DONATIONS ACCEPTED AND APPRECIATED


I will reiterate, my forecasts are based on the available information at the time of analysis, and are only as accurate as the information analyzed and the solutions provided.
Good evening everyone!
Based on analysis of CURRENT forecast information from various global and climate models, it appears at the moment, the 2024 Atlantic Hurricane Season COULD be a very active to “hyperactive” season. As always, this forecast is subject to change as forecast models will continue to update between now and June 01 on a monthly basis. However, as it stands with the available information, it looks like we may experience an above average season. I will reiterate once again, when I post my pre-season, and final seasonal forecasts, the totals are based on BONA FIDE storms, not some of the crap we saw named last season, and seasons previous. I’m speaking of storms that meet the NWS/NHC criteria. First, the system has to start out as a Tropical Disturbance, and as it strengthens, it becomes a depression, storm, and then hurricane:
Tropical Disturbance:
A discrete tropical weather system of apparently organized convection — generally 100 to 300 nmi in diameter — originating in the tropics or subtropics, having a non-frontal migratory character, and maintaining its identity for 24 hours or more. It may or may not be associated with a detectable perturbation of the wind field.
Please note some of the “key” features: apparently organized convection, non-frontal migratory character, and maintaining its identity for 24 hours. Last season, and in some prior seasons, we saw naked swirls being called depressions, and all of a sudden, if a thunderstorm popped up, or an area of deep convection fired up, mainly on the edge of the center, it got named. This does not meet the criteria of apparently organized deep convection, maintaining its identity for 24 hours. They also named systems that had a frontal system still attached, or decaying front through the center of the system. Keep this in mind if you are following this site and the active storms…look for the criteria.
The following is my PRE-SEASON outlook forecast for the upcoming 2024 Atlantic Hurricane Season. Upon re-analysis, using updated information from climate modeling of some items I have taken into consideration, one of them being the current wind shear forecast from the CFSv2 climate model, majority of the climate models showing a moderate to strong La Nina pattern, updated ONI (Oceanic Nino Index) values, MEI values from analog years, I have increased my storm totals slightly. Climate modeling has trended the same, with forecast ONI values only indicating a 0.1C warmer change than what was forecast in Feb. so no real change. I am going to incorporate something a little different. I’m going with a little wider range to account for the lower analog year totals, and higher analog year totals. These totals are based on current climate model information of various parameters from Feb. Should parameters change with subsequent updates, totals are almost sure to change again, between now and June 01, 2024:
STORM W PRE-SEASON FORECAST
TOTAL NAMED STORMS: 20 – 25
TOTAL HURRICANES : 12 – 16
MAJOR HURRICANES: 6 – 9
AVERAGE HURRICANE SEASON:
TOTAL NAMED STORMS: 14
TOTAL HURRICANES: 7
MAJOR HURRICANES: 3
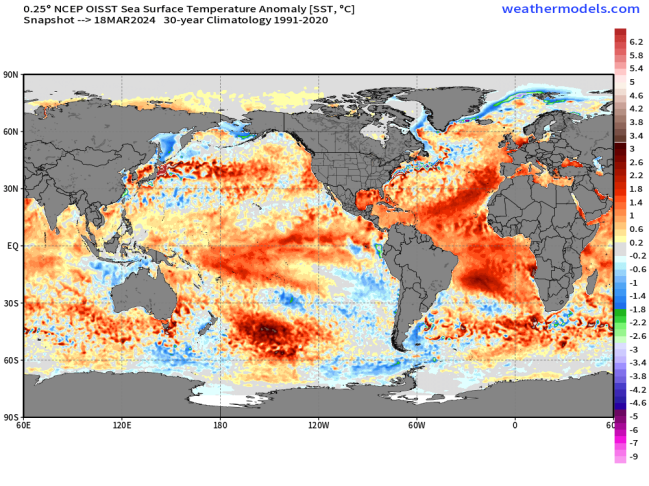
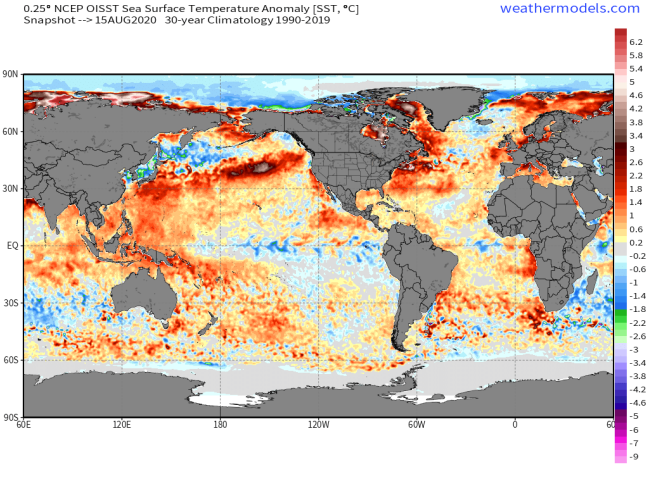
The change in forecast totals is based mainly on updated forecast SST anomalies, zonal wind shear anomalies (MDR REGION) and forecast atmospheric pattern based on the SST anomaly forecast pattern, compared to our busiest season of 2020, which produced 29 total storms, and 1 sub-tropical storm. Although the ONI and MEI history are not good comparisons to the 2020 season, the 2020 season did trend cooler on the ONI from neutral, to La Nina by peak of the season. Currently, IF the climate model predictions are correct, we can expect much colder anomalies in the NINO region, and very warm Atlantic SST’s / anomalies. Everything I have analyzed points to a very active 2024 hurricane season.
The current SST anomalies for time of analysis today, and mid Aug. 2020 are in the following graphics
SST ANOMALIES MAR. 18, 2024
SST ANOMALIES AUG. 15, 2020
ZONAL WIND SHEAR FORECAST FOR 2024

ZONAL WIND SHEAR FORECAST FOR 2020

Forecast parameters used in this synopsis include the following:
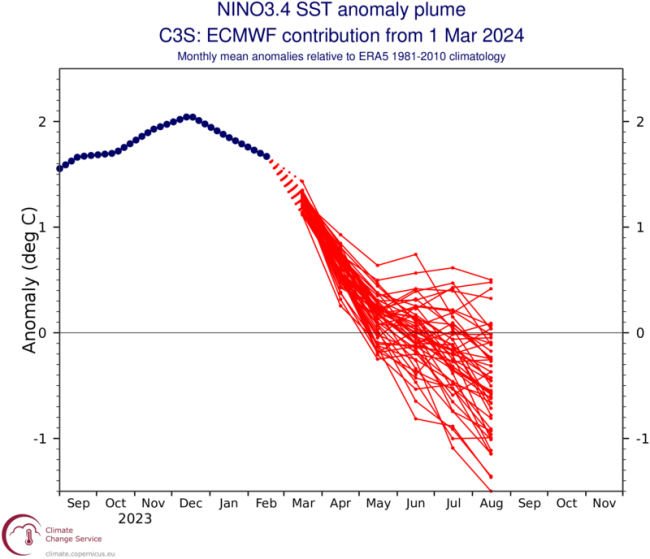
1.) CLIMATE MODEL ENSO PLUME FORECASTS
2.) SST ANOMALY FORECAST
3.) IOD (Indian Ocean Dipole) FORECAST
4.) WIND SHEAR FORECAST
5.) ONI (Oceanic Nino Index) FORECAST TEMPERATURES AND TRENDS
6.) AVERAGING OF CHOSEN ANALOG YEARS BASED ON CPC ONI HISTORY
7.) Past and current MEI (Multivariate ENSO Index) information
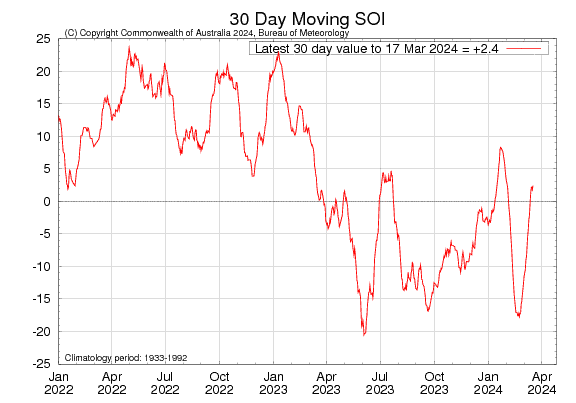
Based on analysis of updated forecast ENSO plumes from global and climate modeling, and updated ONI forecast temperatures and trends, the majority of models seem to indicate the onset of moderate to strong La Nina conditions. As a rule of thumb, the cooler NINO 3.4 becomes, the more favorable conditions over the Atlantic become for storm development, with the opposite effect of a warmer NINO 3.4 region. By JUL- AUG time-frame, it appears we enter moderate to strong La Nina conditions. Based on this, our season “may” start out “normal” in June through a portion of July, as there is generally a 2 month “lag time” between oceanic conditions, and atmospheric coupling, and how quickly the transition may take place. The SOI or Southern Oscillation Index currently indicates the atmosphere is trying to comeback to a La Nina ENSO state. When MSLP is higher over Darwin, and lower over Tahiti, the SOI heads negative and trade winds are blow out of the west, slowing the cooling of the 3.4 region, and pushing warm water toward South America. When this graph is in “positive” territory, it indicates La Nina conditions in the atmosphere, and the opposite occurs. Typically, the lag time is about 2 months between coupling of the ocean and atmosphere. This means for the atmosphere to be declared in either El Nino or La Nina state, the graph has to be either +>7 or -7 or less for at least 2 months. Here is a little explanation from the BOM:
Sustained positive values of the SOI above +7 typically indicate La Niña, while sustained negative values below −7 typically indicate El Niño. Values between +7 and −7 generally indicate neutral conditions.
You’ll note the current SOI.
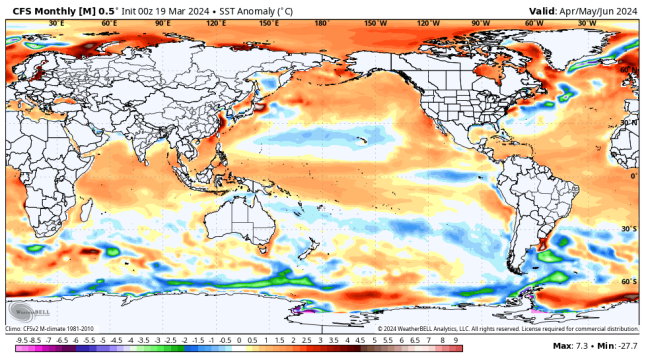
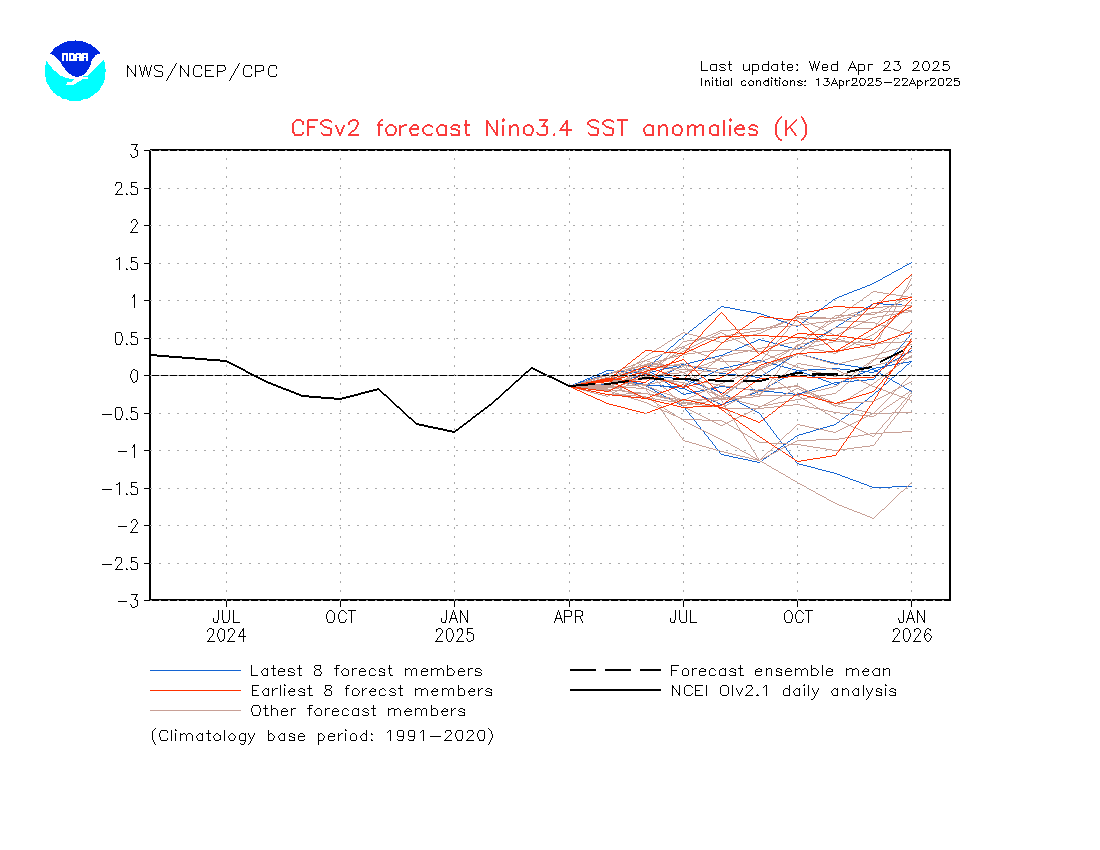
The following SST anomalies forecast is from the CFSv2 climate model, NMME model, CanSips model, and ECMWF seasonal, indicating the forecast NINO 3.4 pattern:
CFSv2 SST ANOMALIES FORECAST APRIL – JUNE
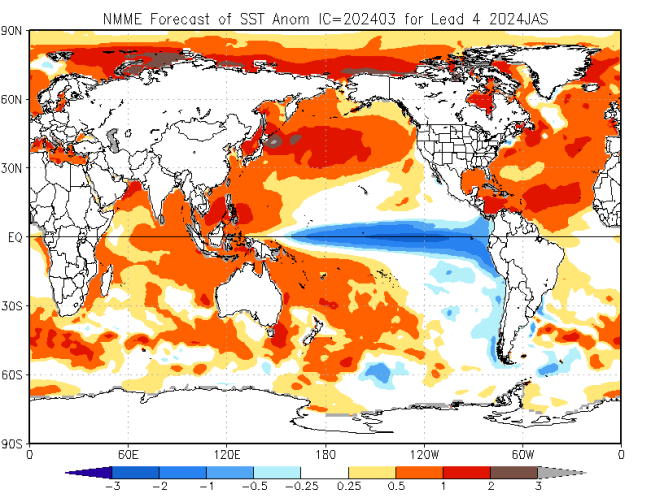
NMME SST ANOMALIES FORECAST JULY – SEPTEMBER (CLICK IMAGE FOR ALL MODELS)
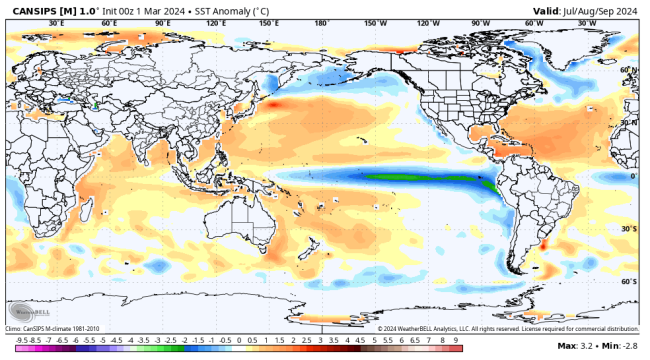
CANSIPS SST ANOMALIES FORECAST JULY – SEPTEMBER
ECMWF SEASONAL ANOMALIES FORECAST
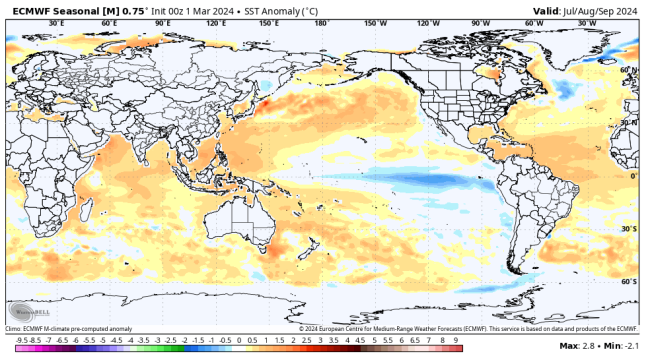
You’ll note in the SST anomalies forecast maps, the majority of the modeling shows an extensive tongue of colder anomalies from the west coast of South America, westward, and warmer anomalies over the MDR region. IF these anomalies forecasts do materialize, especially the CanSips forecast, the SST pattern indicates a very busy 2024 hurricane season.
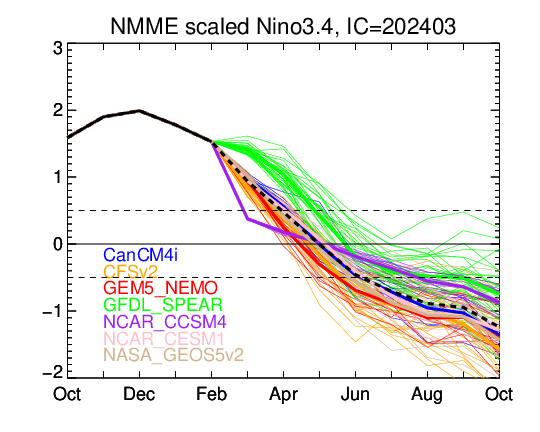
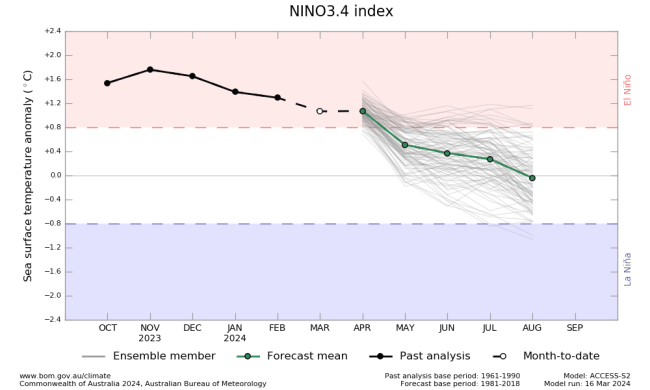
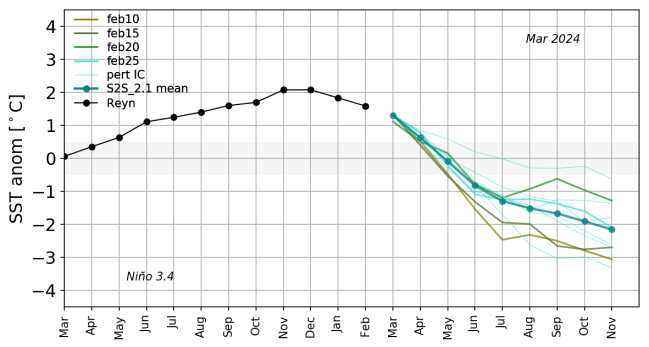
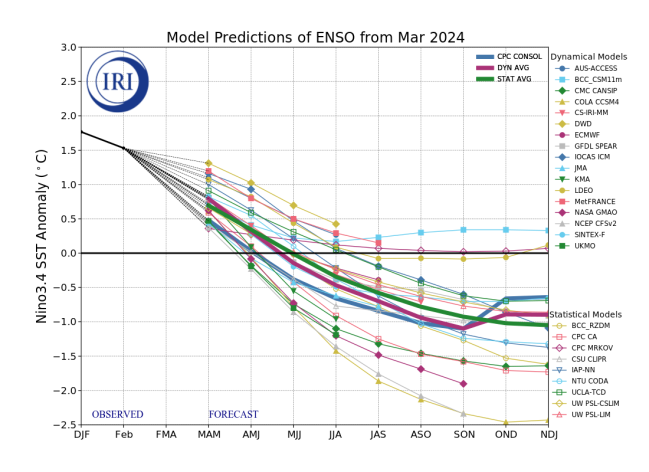
The following are updated ENSO plumes forecasts
NMME CLIMATE MODEL NINO PLUMES FORECAST GRAPHS (CLICK IMAGE FOR MORE MODELS):
CFSv2 (LINKED)
BOM (AUSTRALIA BUREAU OF METEOROLOGY)
NASA GEOS
UKMET
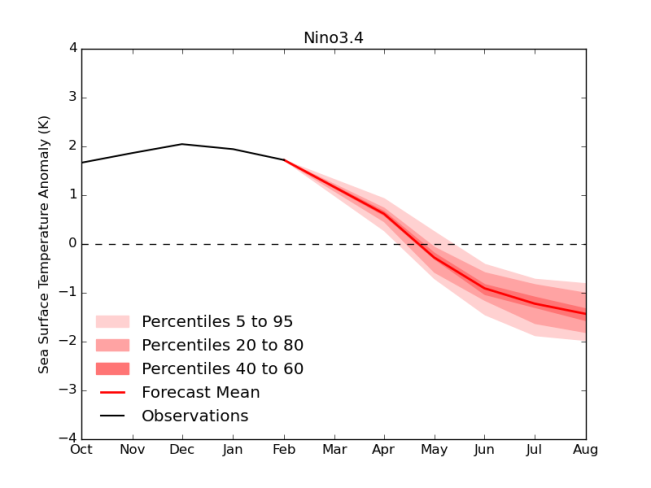
ECMWF
IRI / CPC
JMA MODEL

I’m going to discuss two other important factors regarding development over the Atlantic ocean. The first involves the Gulf of Guinea. The second involves the IOD (Indian Ocean Dipole).
The Gulf of Guinea is the northeastern most part of the tropical Atlantic Ocean from Cape Lopez in Gabon, north and west to Cape Palmas in Liberia.
I am going to forgo mentioning what the climate models indicate about the Gulf of Guinea forecast temperature anomalies, as they have not panned out over the past few hurricane seasons. I will however state the role played by the Gulf of Guinea. When the Gulf of Guinea is warmer than average/normal (warm anomalies) or a warm neutral, the ITCZ has the tendency to remain further south, (Equatorward) during the season. This is what occurred in the 2021 hurricane season, as we saw many tropical waves exit below 10 degrees north latitude. In addition, we saw many SAL occurrences, even into August. The heaviest of the SAL outbreaks climatologically occur in the month of July. With the ITCZ further south, it doesn’t extend into the Sahel region of Africa, hence drier conditions and more dust. When the Gulf of Guinea experiences cooler anomalies (colder than normal), it allows for a shift northward in the ITCZ/Monsoon trough, due to the reverse pressure pattern, bringing greater rainfall to the Sahel region, which would aid in a reduction in the SAL.
GULF OF GUINEA
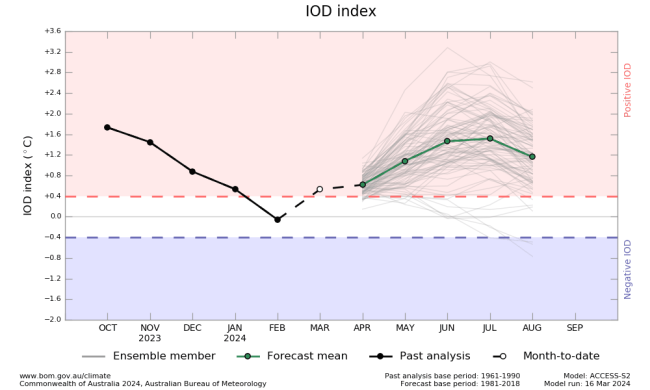
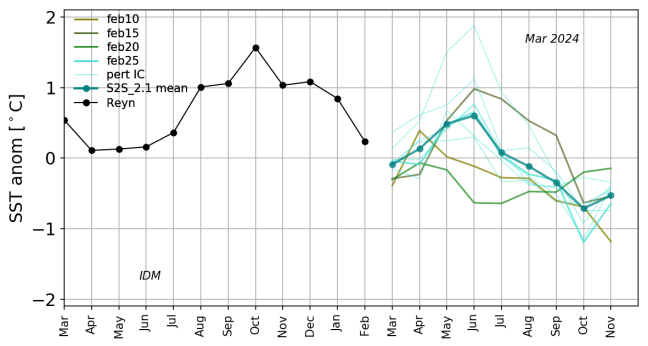
 Another item in the forecast regarding Sea Surface Temperature Anomalies is the IOD (Indian Ocean Dipole). The forecast from climate modeling tends to show the IOD going to a “positive” phase by April at +0.3, peaking at +0.8 by June, then falling back to around +.05 come Aug. This would be a slightly to non negating factor in hurricane development. However, given the forecast for very warm Atlantic SST’s and the IOD forecast coming back to “warm” neutral by the peak of the season, there could be an offset of negating factors. During a positive IOD phase, you’ll notice the “Walker” circulation allowing for an increase in convection and rain near east Africa. The rising air causes lower pressure and precipitation at the ocean surface. You’ll see on the eastern side of the circulation, air sinks to the surface, causing higher pressure at the surface and drier conditions. Well, it just so happens, this exact flow happens on the western portion of the circulation. The air rises, and as it reaches the upper portion of the atmosphere, it cools, then begins to sink (higher pressure). As this air in the upper atmosphere sinks, it compresses and heats, drying out the air, hence the “lack” of convection for easterly waves. A negative IOD phase has the opposite effect. As the air “sinks” over the western Indian Ocean, it spreads out over the surface, and across eastern Africa. The pattern then continues with the air “rising” over central Africa, allowing for, or aiding in the formation of convection.
IOD SST ANOMALIES NEGATIVE / POSITIVE

IOD POSITIVE PHASE

IOD NEUTRAL PHASE

IOD NEGATIVE PHASE

CURRENT IOD FORECAST FROM BOM, UKMET, AND NASA GEOS

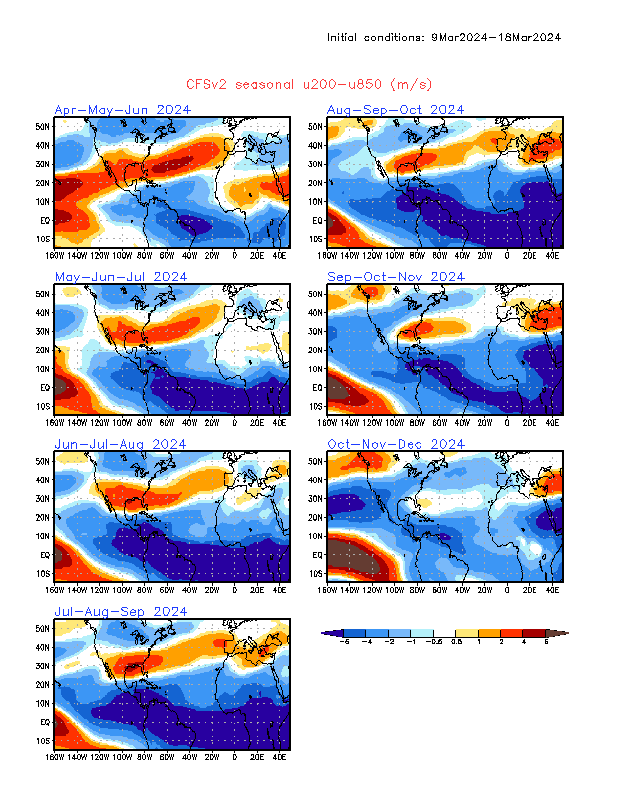
With the forecast of a moderate to strong La Nina, the CFSv2 is showing somewhat below to strongly below average wind shear over the Atlantic basin (MDR). Shear over the MDR is another negating factor for the hurricane season.
CFSv2 CURRENT SEASONAL u200 – u850 (ZONAL WIND SHEAR) FORECAST
Again, as all of these parameters update during the next 2 months, adjustments may have to be made, prior to issuing a final seasonal forecast.
Based on analysis of forecast ONI values from the IRI (International Research Institute), which uses 26 different climate models, I came up with the following past hurricane seasons as analog years: 1995, 2005, 2010, and 2016. This was determined from the ONI values and / or value trends based on the average of ALL the climate models, comparing them to the CPC ONI chart, with the years that matched the forecast anomalies, and/or anomaly trends, along with past and current MEI information. The IRI provides an average of the Dynamical models, Statistical models, and an average of ALL 26 models output.
The ONI explained from the site, HDX:
Monthly Oceanic Nino Index (ONI)
The Oceanic Niño Index (ONI) has become the de facto standard that the National Oceanic and Atmospheric Administration (NOAA) uses to identify El Niño (warm) and La Niña (cool) events in the tropical Pacific. It is the three month mean SST anomaly for the El Niño 3.4 region (i.e., 5°N-5°S, 120°-170°W). Events are defined as five consecutive overlapping three month periods at or above the +0.5°C anomaly for warm (El Niño), events and at or below the -0.5 anomaly for cold (La Niña) events. The threshold is further broken down into Weak (with a 0.5 to 0.9 SST anomaly), Moderate (1.0 to 1.4) and Strong (≥ 1.5) events. For an event to be categorized as weak, moderate or strong, it must have equaled or exceeded the threshold for at least three consecutive overlapping three month periods.
Based on the average of the 4 analogs (20.25 storms total, 11.25 hurricanes and 5.25 major hurricanes), my pre-season forecast totals were derived in this manner, however reflect current uncertainties in forecast conditions. Though the average is a little lower than my forecast totals, I’m taking into account the probability of a strong La Nina, with very little shear, and the fact 3 of the 4 analogs were 19 storms on the low end, and 28 on the high end.
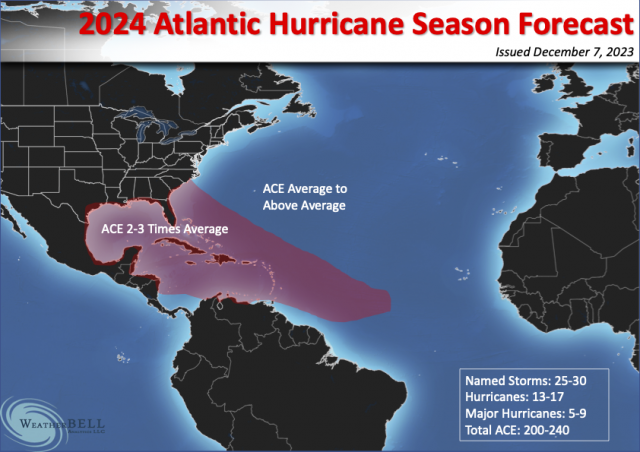
With the forecast of the SST anomaly pattern for the 2024 season, it is very possible to have a steering pattern that may keep storms in the MDR and Caribbean and could resemble a strike area to what Meteorologist Joe Bastardi from Weatherbell Analytics has proposed, vice the multiple re-curving systems we saw in 2023. Generally speaking, during a La Nina or Neutral ENSO, more U. S. landfalls occur.
FROM JOE BASTARDI WEATHERBELL ANALYTICS
FLORIDA CLIMATE CENTER ARTICLE HURRICANE LANDFALLS
https://climatecenter.fsu.edu/topics/tropical-weather/regional-effects-of-enso-on-us-hurricane-landfalls#Tropical%20Cyclone%20Steering
If you would like a copy of the Hurricane Preparedness post, or previous Hurricane Tutorials, please send me an email.
You may direct any questions this season by contacting me personally, ANYTIME, at: twalsh22000@yahoo.com
Have a blessed evening!
T. F. “STORM” WALSH III
GMCS, USCG (ret)
METEOROLOGIST / HURRICANE SPECIALIST /SEVERE WEATHER SPECIALIST
MEMBER WEST CENTRAL FLORIDA AMS


