
This review of the 2013 Atlantic Hurricane Season is my professional opinion, based on analysis of certain factors that occurred during the course of the season, from both memory, and available current information. This summary may give some insight as to why the season totals were only slightly above average, and as to possibly why we had such a lack of hurricane activity. My Pre-Season prediction was for 16-18 Named Storms, 9-10 Hurricanes, 5-6 Intense. Once signals began displaying negative values, I lowered my prediction to 14-16 named storms, 6-8 Hurricanes, and 3-4 Intense.
The Atlantic Hurricane Season finished with 13 Named Storms, 2 Hurricanes, and 0 Intense. Based on comparable ENSO Neutral years and ONI parameters, this was unusual.
First off, I’d like to begin with SSTA’s (Sea Surface Temperature Anomalies).
SSTA’s are values of SST departures, either plus or minus, from the average, or “normal” SST’s which have been averaged over many years. The 2013 Atlantic Hurricane Season actually saw for the most part, a lowering or cooling of these anomalies as the season moved closer to the “‘peak”. This pretty much has an effect on how much instability is available near the surface, and the amount of “lift” produced in the MDR, per sey as Mother Nature sees it. Warmer sst’s will allow for more moisture to be paced into the atmosphere, and as this moisture evaporates, will place more latent heat energy in the air column. This kind of goes hand in hand with another parameter which will be discussed.
If you notice the following Operational SST Anomaly Charts, we experienced anomalies of 1.5C to 2.0C above the “norm” or average at the beginning of May. These anomalies were part of my basis for working out my formula for storm and hurricane totals. I know other agencies as well utilized these for making their seasonal forecasts. You will also notice another parameter, the Atlantic Ocean Tripole. This is noted by warmer anomalies from around 50N, northward, cooler anomalies just south of that, then warmer anomalies toward the MDR. The setup of this feature allows for what we refer to as net lift in the MDR, as the cooler anomalies are indicative of sinking air, and the warm anomalies allow air to rise. This is one parameter that led me to believe we would experience more than slightly above average activity.
OPERATIONAL SST ANOMALIES MAY 02, 2013
Now, note the anomalies as we got further into the season…
OPERATIONAL SST ANOMALIES JUNE 03, 2013
AUGUST 01, 2013
We did see a slight increase in anomalies by the end of September, however this did not overcome to warmer anomalies to the north of the MDR. With warmer anomalies north of the area, and lack of the Tripole, we just didn’t have the “lifting” motion in place, most of the season.
The cooling of the MDR can most likely be attributed to 2 major parameters, the first of which I’ll touch on is the NAO (North Atlantic Oscillation). The NAO is, in basic, the fluctuation in differences in pressure between the Azores / Bermuda High, and the Icelandic low. The following graphic depicts the winter time phase, however you can get the idea that a POSITIVE NAO involves a strong Icelandic Low, and a strong Azores High, while a NEGATIVE NAO involves the weaker of both.
NAO

For most of the 2013 Hurricane Season, the NAO averaged POSITIVE, with the following monthly averages:
JUN +0.83
JUL + 0.70
AUG +1.12
SEP +0.38
OCT -0.88
NOV +.081
As you can see in the graph, the positive phase began about 6 months in to 2013:
A positive NAO is in association with a stronger Azores / Bermuda High. This mean an increase in trade winds over the Atlantic Basin. This in turn leads to a higher rate of evaporation, which then tends to cool the air and waters over the MDR, as well as creating up-welling off the African coast. The faster trades also have a tendency to increase vertical wind shear values. Another attribute leading to cooling of the sst’s in the MDR, is the SAL (Which will be discussed regarding the dryer air we saw this season), as heavy layers block out sunlight.
DRY AIR:
Dry air the season seemed to plague the Atlantic Basin most of the season. It appeared as if we experienced a little more of the SAL this past season, which usually, the worst outbreaks occur in July. As a general rule of thumb, this dust originates over the western portion of the African Sahara desert.
SAL
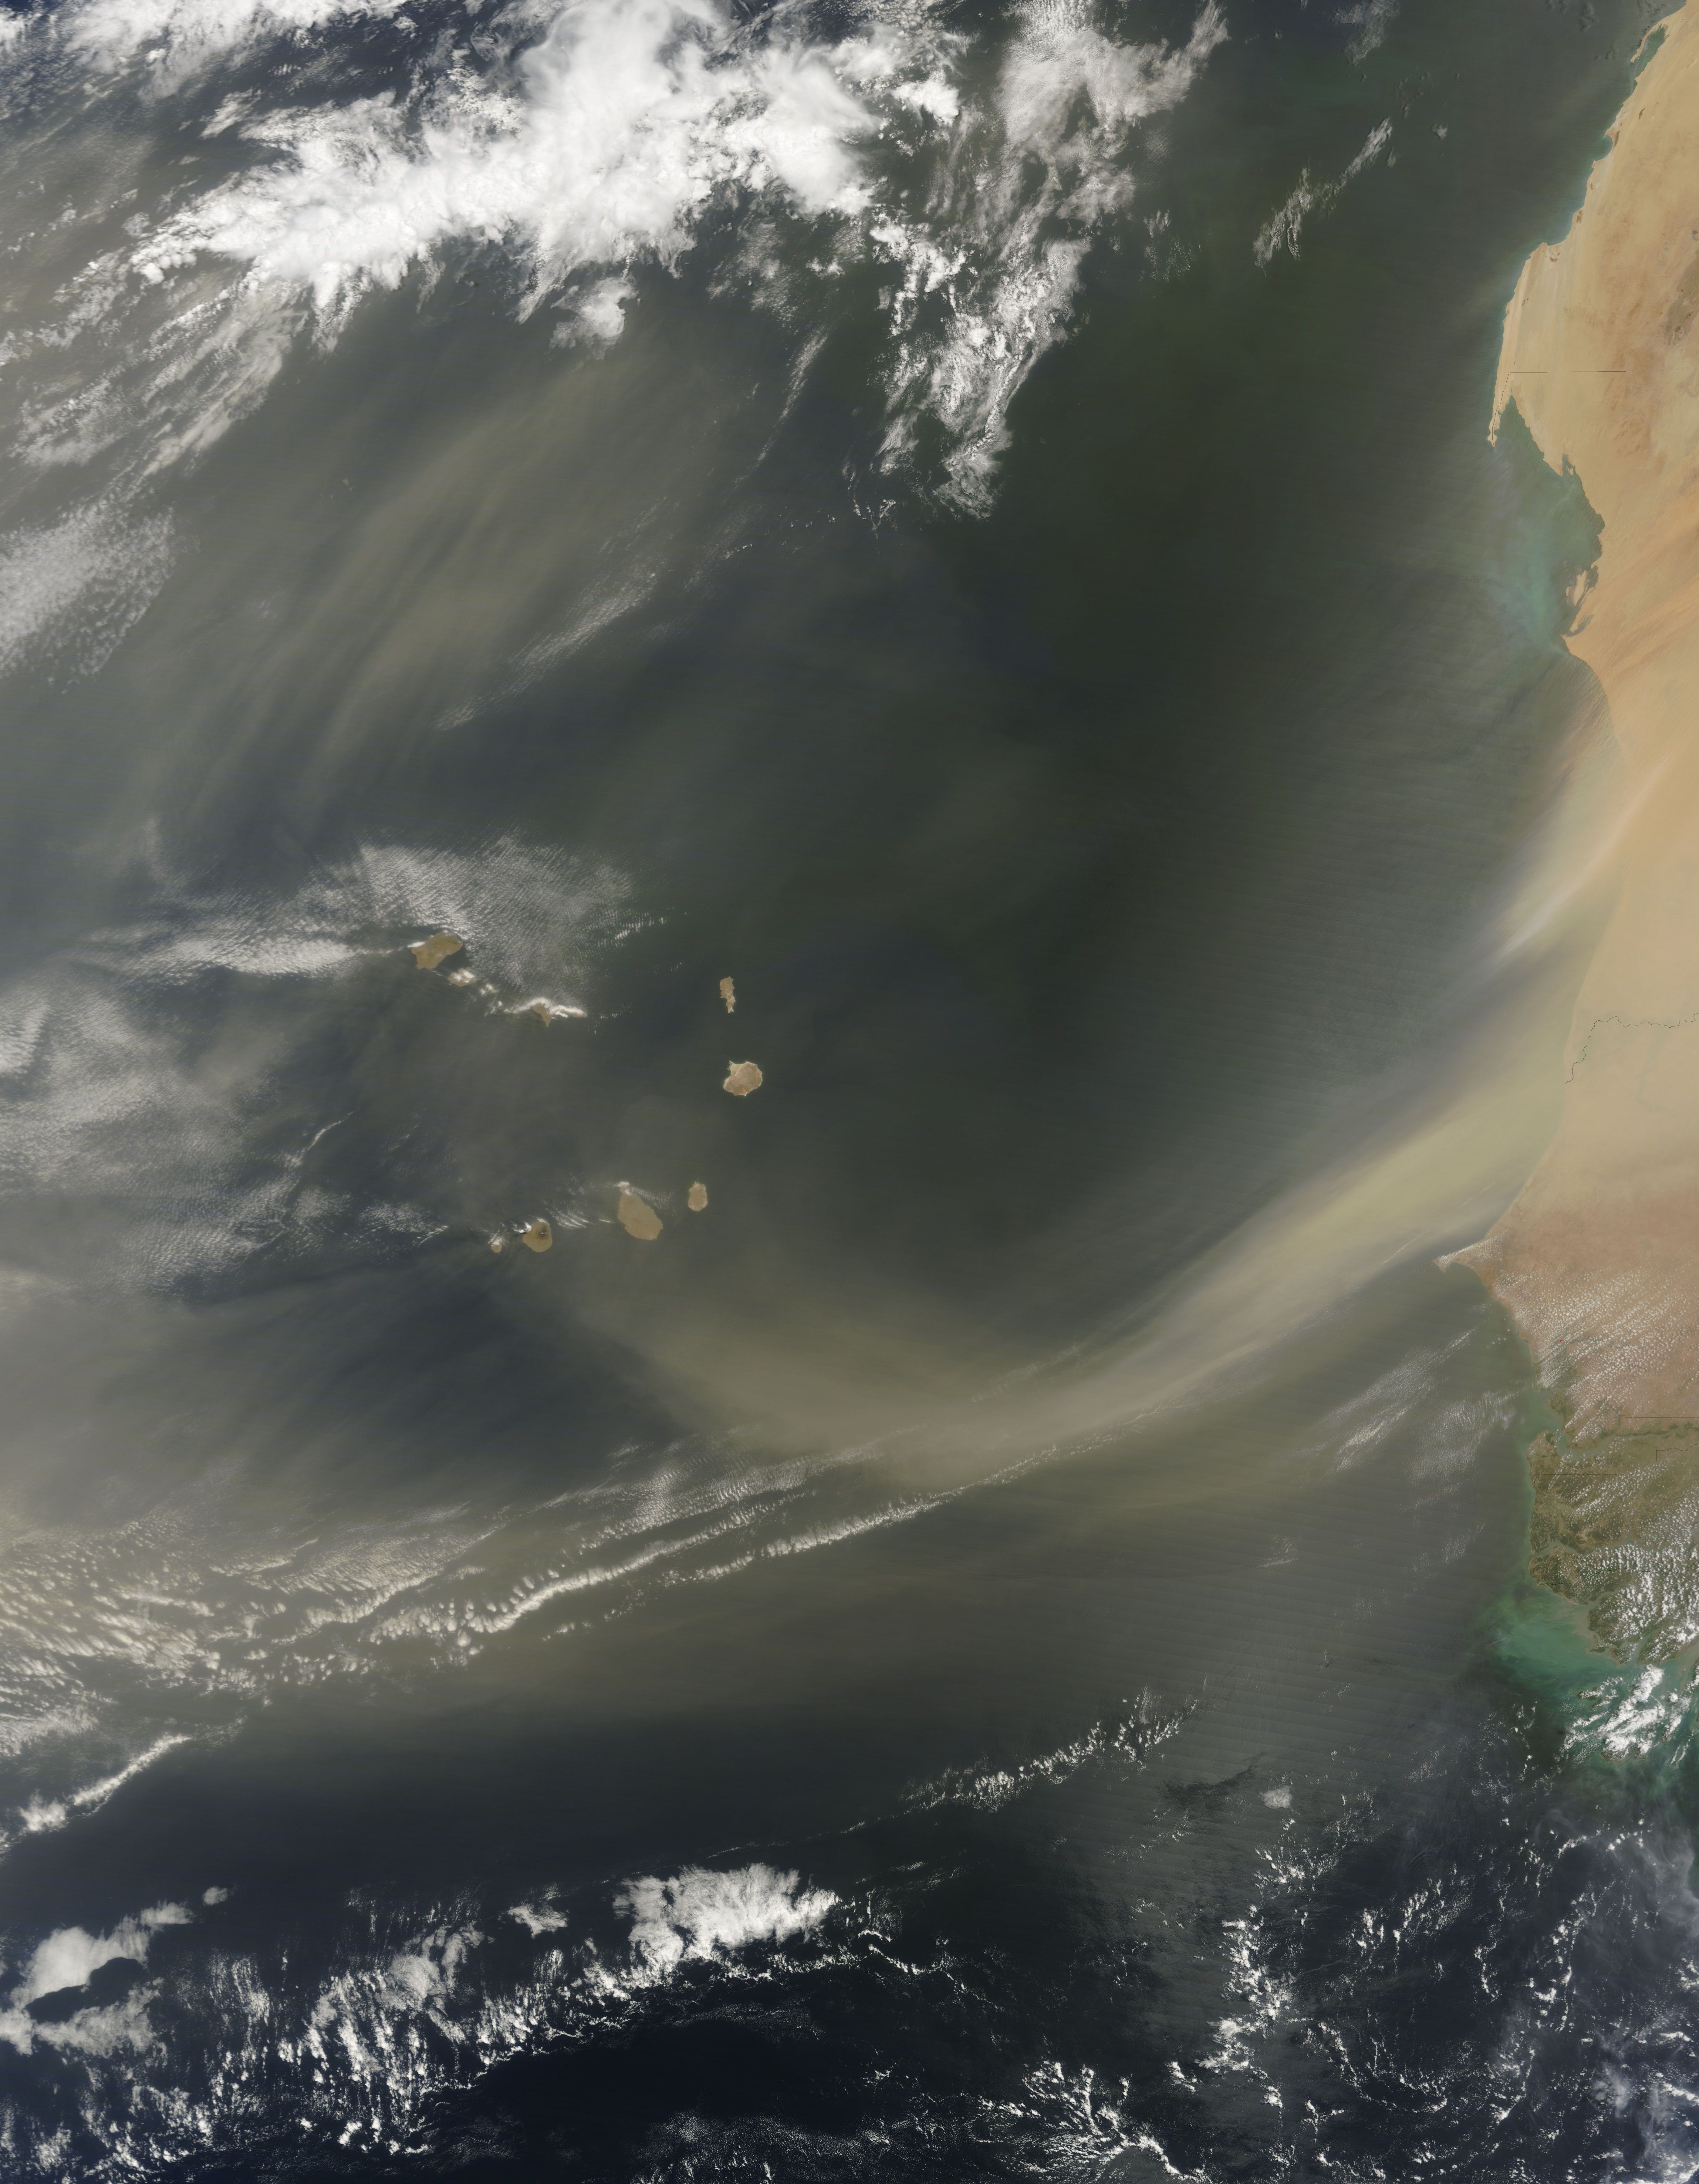
Usually, after July, this dust becomes minimal. However, during the 2013 hurricane season, in my analysis and observations, I noted something different. It was almost as a semi-permanent high pressure cell was located extremely far north of Africa. It was noted, that dust was being brought down very far north and east, and being transported toward the west African coast. The Magenta line, with red arrows indicating direction, show where a majority of the dust was transported from this past season.

Again, the SAL will not allow for development of easterly waves that exit Africa, in addition to blocking the sun, which doesn’t allow for the sea to warm below it.
In addition to the SAL, the presence of a stronger Azores / Bermuda high attributed to dry air. With above average pressure anomalies, air over the Atlantic Basin became drier. As high pressure winds blow clockwise in our hemisphere, the spread out and sink. As this sinking occurs, the air is compressed and warmed, which has the tendency to dry out the air. With the stronger sinking motion of an above “normal” if you will, subtropical high, this is what occurred. With the sinking air, this suppresses cloud formation. Lack of clouds…lack of storms.
MJO (Madden Julian Oscillation)
The MJO did not favor our basin much this past season, with only two or three pretty good upward motion phases noted during the season. From Wikipedia:
The Madden–Julian oscillation (MJO) is the largest element of the intraseasonal (30–90 days) variability in the tropical atmosphere. It is a large-scale coupling between atmospheric circulation and tropical deep convection.[1][2] Rather than being a standing pattern (like ENSO) it is a traveling pattern, propagating eastwards at approximately 4 to 8 m/s (9 to 18 mph), through the atmosphere above the warm parts of the Indian and Pacific oceans. This overall circulation pattern manifests itself in various ways, most clearly as anomalous rainfall. This was discovered by Roland Madden and Paul Julian (again the comparison with ENSO is instructive, since their local effects on Peruvian fisheries were discovered long before the global structure of the pattern was recognized).
The MJO is characterized by an eastward progression of large regions of both enhanced and suppressed tropical rainfall, observed mainly over the Indian Ocean and Pacific Ocean. The anomalous rainfall is usually first evident over the western Indian Ocean, and remains evident as it propagates over the very warm ocean waters of the western and central tropical Pacific. This pattern of tropical rainfall then generally becomes nondescript as it moves over the cooler ocean waters of the eastern Pacific (except over the region of warmer water off the west coast of Central America) but occasionally reappears at low amplitude over the tropical Atlantic and higher amplitude over the Indian Ocean. The wet phase of enhanced convection and precipitation is followed by a dry phase where thunderstorm activity is suppressed. Each cycle lasts approximately 30–60 days. Because of this pattern, The MJO is also known as the 30–60 day oscillation, 30–60 day wave, or intraseasonal oscillation.
MJO SIMPLE DIAGRAM

Upward motion phases for the Caribbean and Atlantic basins occur when the MJO Multivariate index shows the MJO into Octants 1 and 2. When this occurs, we see enhanced convection in these basins, along with lift in the atmosphere, which almost always aids in tropical cyclone initiation. This process however is more relied on during the months of June and July. At any rate, the MJO signal was fairly scarce in our basin this past season. This, along with the dry air mentioned, pretty much did not allow for the formation of as many systems as I though would be.
IOD (Indian Ocean Dipole)
The IOD involves a aperiodic oscillation of sea-surface temperatures, between “positive”, “neutral” and “negative” phases. A positive phase sees greater-than-average sea-surface temperatures and greater precipitation in the western Indian Ocean region, with a corresponding cooling of waters in the eastern Indian Ocean—which tends to cause droughts in adjacent land areas of Indonesia andAustralia. The negative phase of the IOD brings about the opposite conditions, with warmer water and greater precipitation in the eastern Indian Ocean, and cooler and drier conditions in the west.
Somewhat similar in nature to the Atlantic Ocean Tripole, I am still in the process of conducting further research on this entity. However, research has provided information that in a negative IOD setup, the West African Monsoon circulation is not likely to be disrupted, in which the West African Monsoon is a Bi-weekly oscillation in itself. We did experience a negative IOD this past season, and the West African Monsoon trof appeared to behave fairly well. However, early in the season, or just prior to, a fellow meteorologist, Joe Bastardi from Weather Bell had opined that with a negative IOD, we would see a weak season, as far as strength of storms. Evidently, this proved correct. I have not been able to research this as of yet as to why, however a thought that comes to mind is, with a negative IOD phase, convection does not occur along the SE coast of Africa, nor that portion of the Indian Ocean. Just off the top of my head, this lack of convection in that area may have been an inhibiting factor in the process that produces tropical waves. This may have been a reason for the lack of tropical wave activity over Africa. I do intend to research more on the IOD regarding the Atlantic Hurricane Season.
IOD GRAPHIC

So, based on all of my analyses during the season, and what research I have accomplished, this narrative contains my findings and thoughts as a meteorologist as to why we did not attain the total number of storms predicted at the very beginning of the season, and as to the lack of hurricane activity. As to why these conditions came about during a NEGATIVE ENSO signal is another story.
T. F. “STORM” WALSH III
GMCS, USCG (ret)
METEOROLOGIST / HURRICANE SPECIALIST
MEMBER WEST CENTRAL FL AMS
CERTIFIED SKYWARN OFFICIAL STORM SPOTTER (advanced)
CoCoRaHS OBSERVER


Thanks Storm, its going to take this boatswain mate a little while to digest this. I guess the MJO can be fickle! I for one appreciate the hard work you do for us.
Thanks Mike! I hear ya! Hell, you should have tried writing it up! LOL!!
Happy New Year Storm! Thanks for your hard work in detailing your reasoning for the abnormal season during this busy time of year. And those of us that live down here near the central Gulf Coast thank God for the below normal Hurricane season.
Thank you! Happy New Year!!
Storm, thank you for your hard work, and for me, a detailed explanation. I don’t know how you put this all together–great job. I’ll have to read and re-read this several times, gets a bit complicated, for me anyways!.– Right now up here, all the “buzz” is about the possible snow storm for the Northeast Thurs/Friday. This is pretty complicated too. We’ll know better by Tuesday PM sometime. I’ll have my ruler out, or yard stick if necessary! Thanks again.
Thanks LT! Well, just things I tucked away in the back of my mind that I noticed in daily analysis, because I know most of the time during the season, I had the same questions…like…WTF?
Storm…the NHC couldn’t have given a better explanation. I guess the two things that would stick out to me would be the negative ENSO and more importantly…the MJO and her bag of tricks. Simply put…crazy. Just my opinion…but we in DEN are at 33% of snowpack for this time of year. With slightly negative ENSO and a favorable AO/NAO pattern…you would think…we would be in a favorable pattern for increased snowfall. Don’t know…you’re the expert Storm. I know this…something’s got to give…and eventually it will…just a matter of time with this whacky setup. Thank you Storm always for your continuous dedication. You make a lot of people in the gang feel much safer. God Bless…always thankful.
Thanks Monty!